


Hihglights: JP Morgan Guide to the Markets 3Q 2025
My comments about the information I find most interesting

At the beginning of July, JP Morgan published its guide to the markets for the third quarter of 2025. Although I don’t like to spend too much time studying the economy in general, we as investors need to know where we are at. So let’s dive into the information I find most interesting and my interpretation of it:
Range of stock, bond, and blended total returns
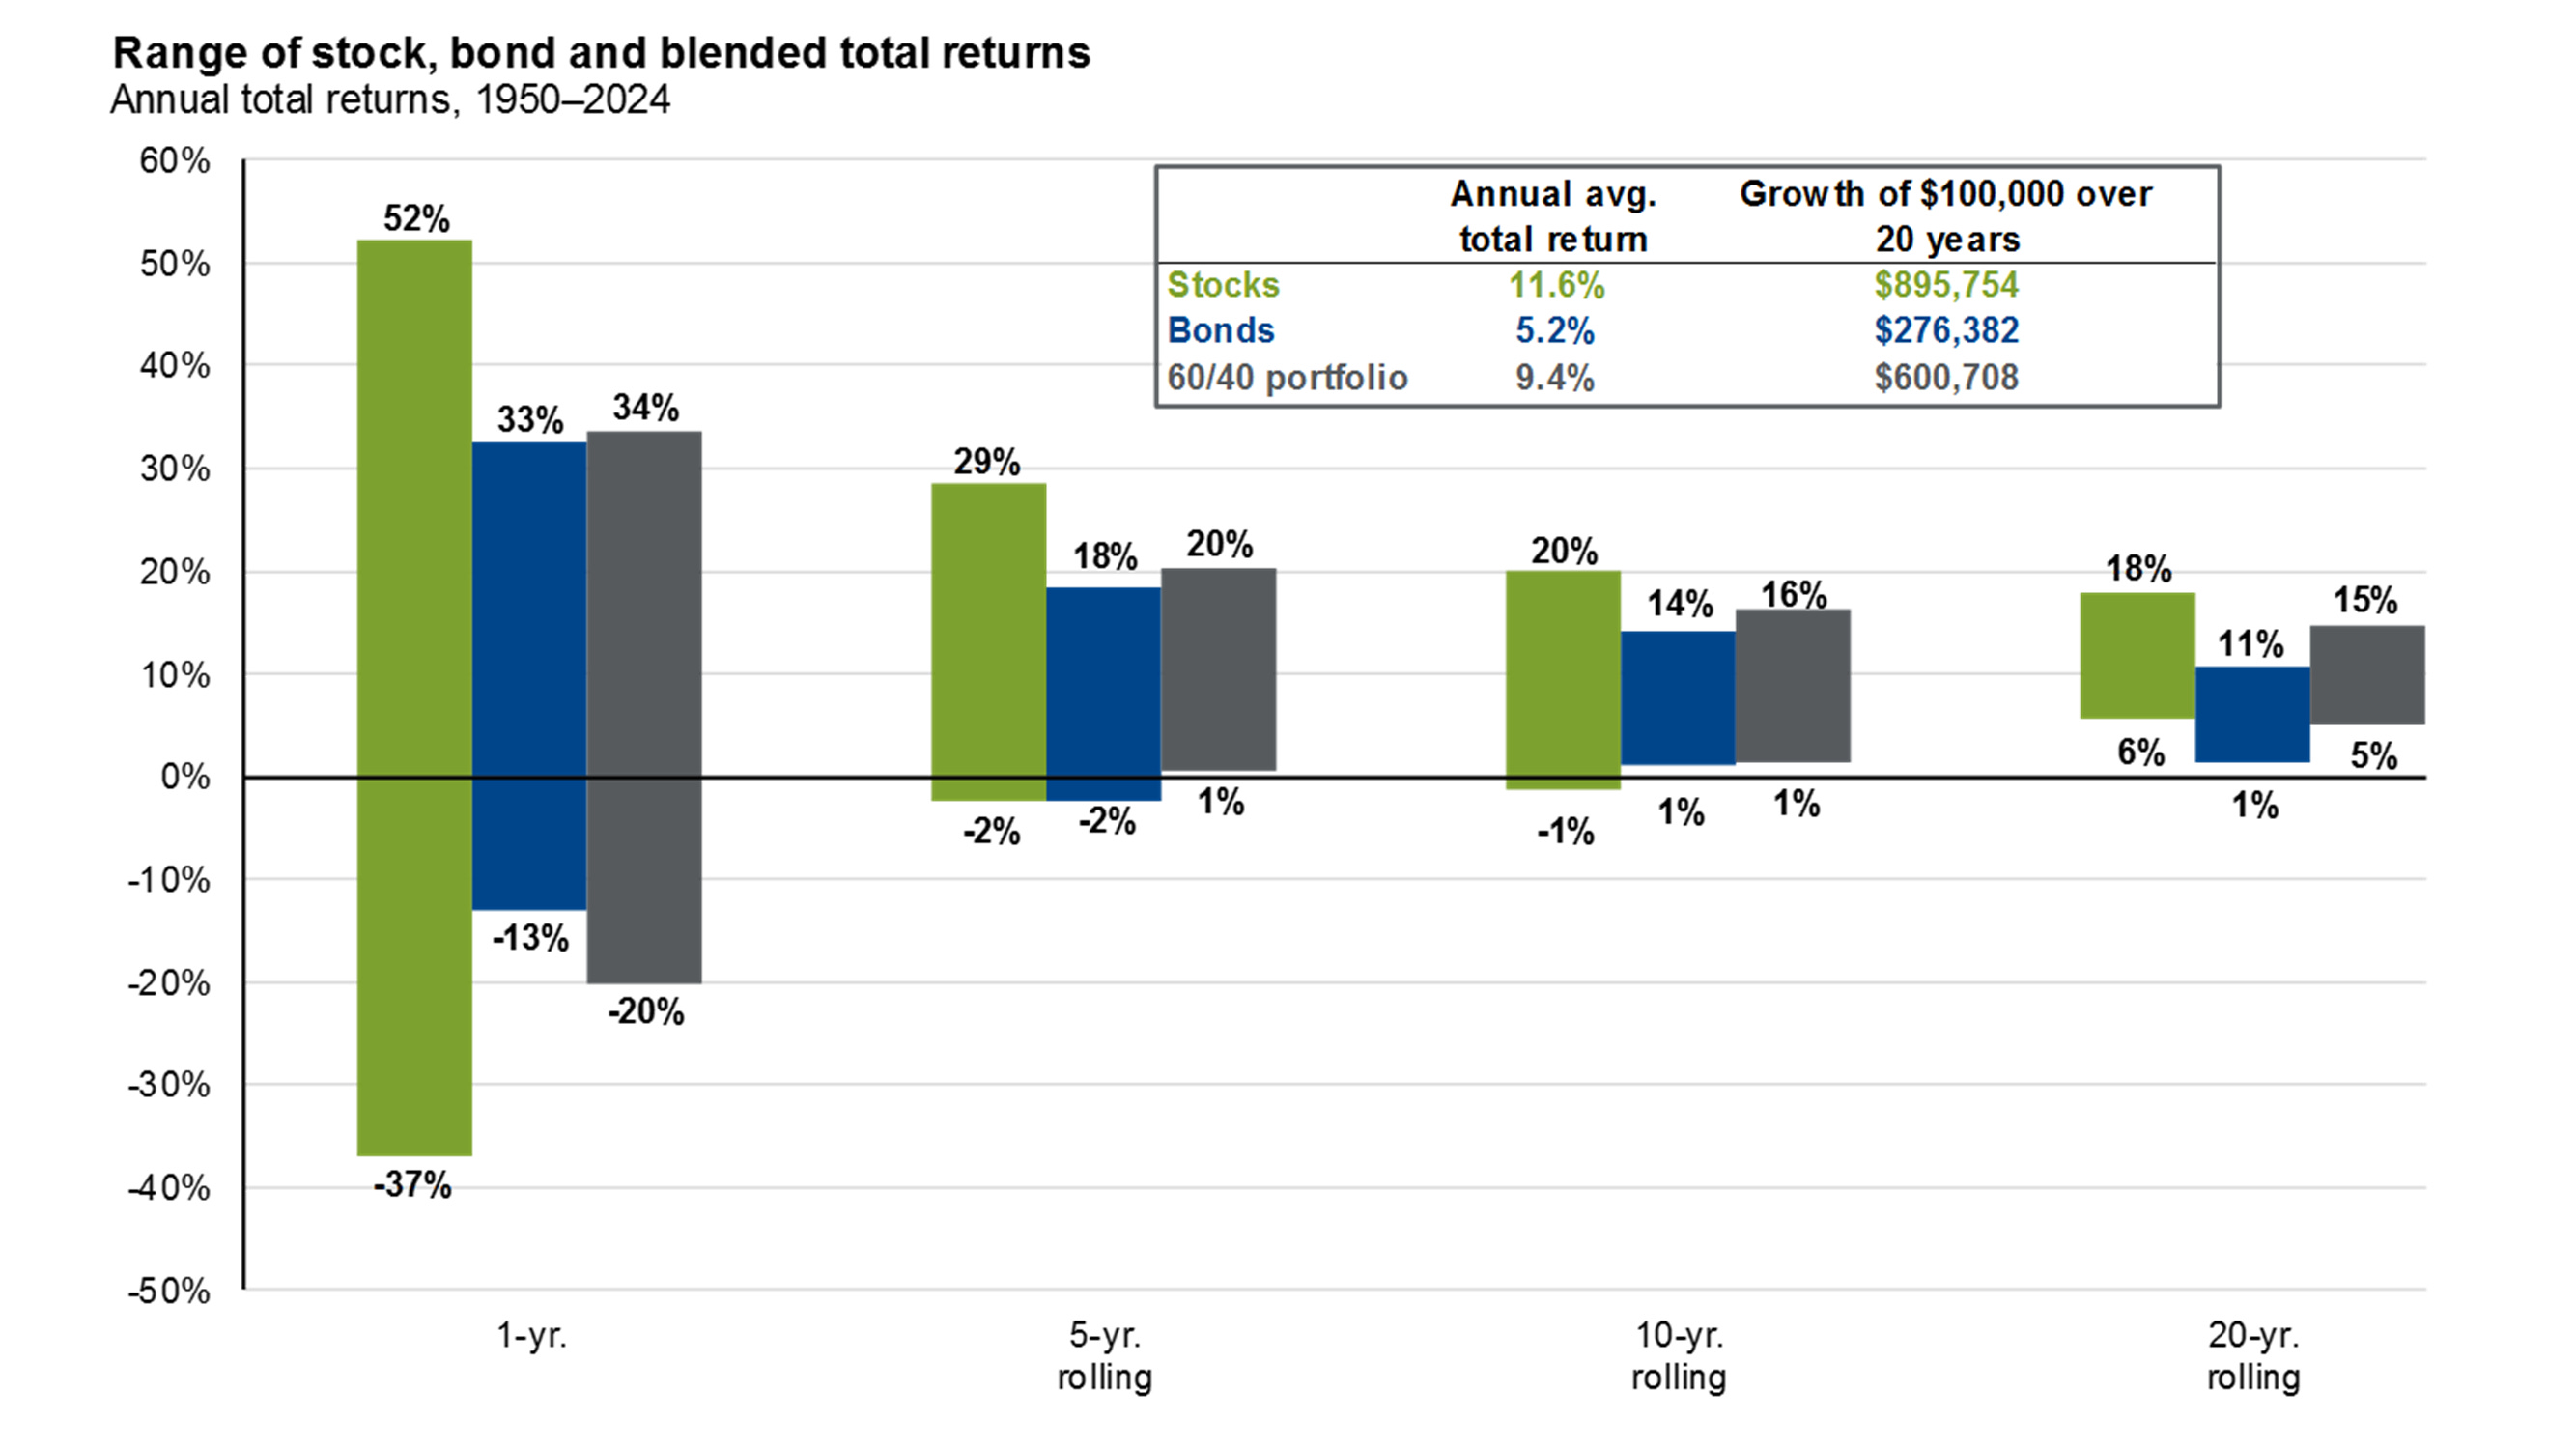
This is a classic graphic of JP Morgan’s guide to the markets. I always find it interesting, since it shows that in a 1-year time frame, stocks offer the highest potential return and the highest drawdown (green line). However, in the long term, in any 20-year rolling period, stocks not only offer the highest potential return, but also the highest performance in the worst-case scenario. This demystifies the idea that “stocks are riskier”, since risk comes from having a short-term horizon.
S&P 500 Index: Forward PE Ratio
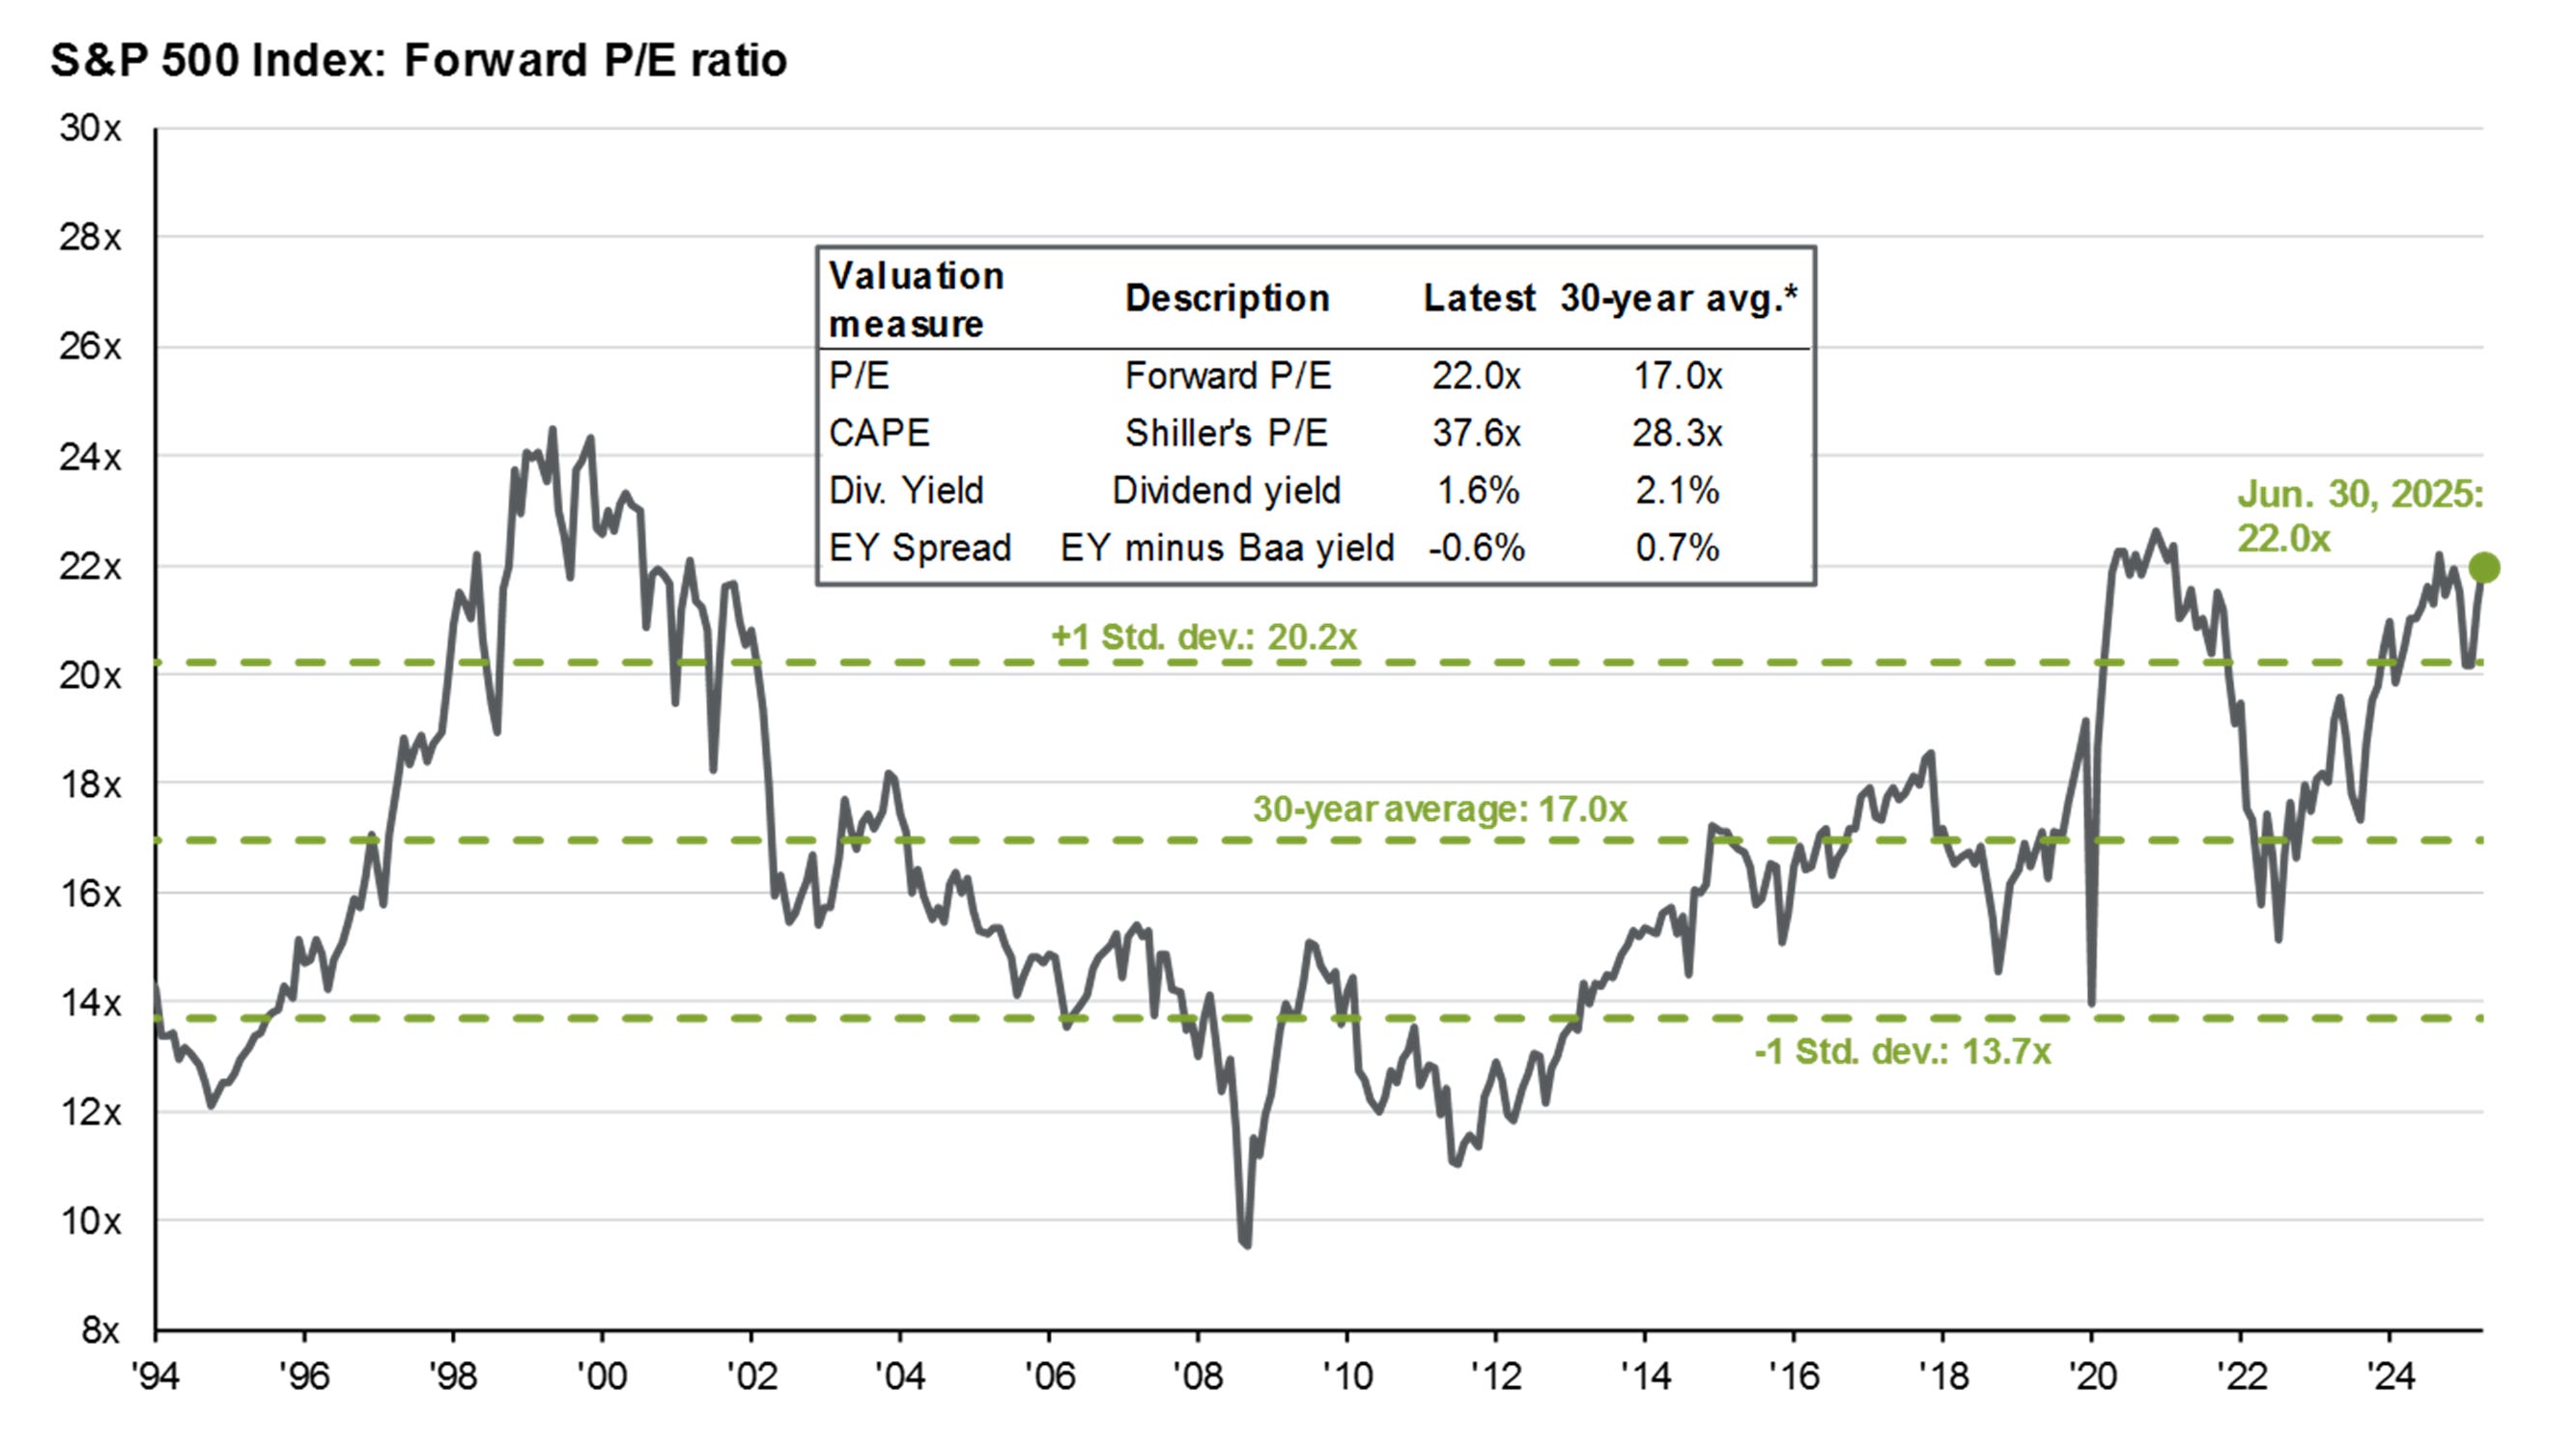
The current valuation of the SP500 sits at 22 forward PE. This is considerably higher than its 30-year average of 17 times, and also higher than the average plus one standard deviation of 20.2 times.
Forward PE and subsequent returns
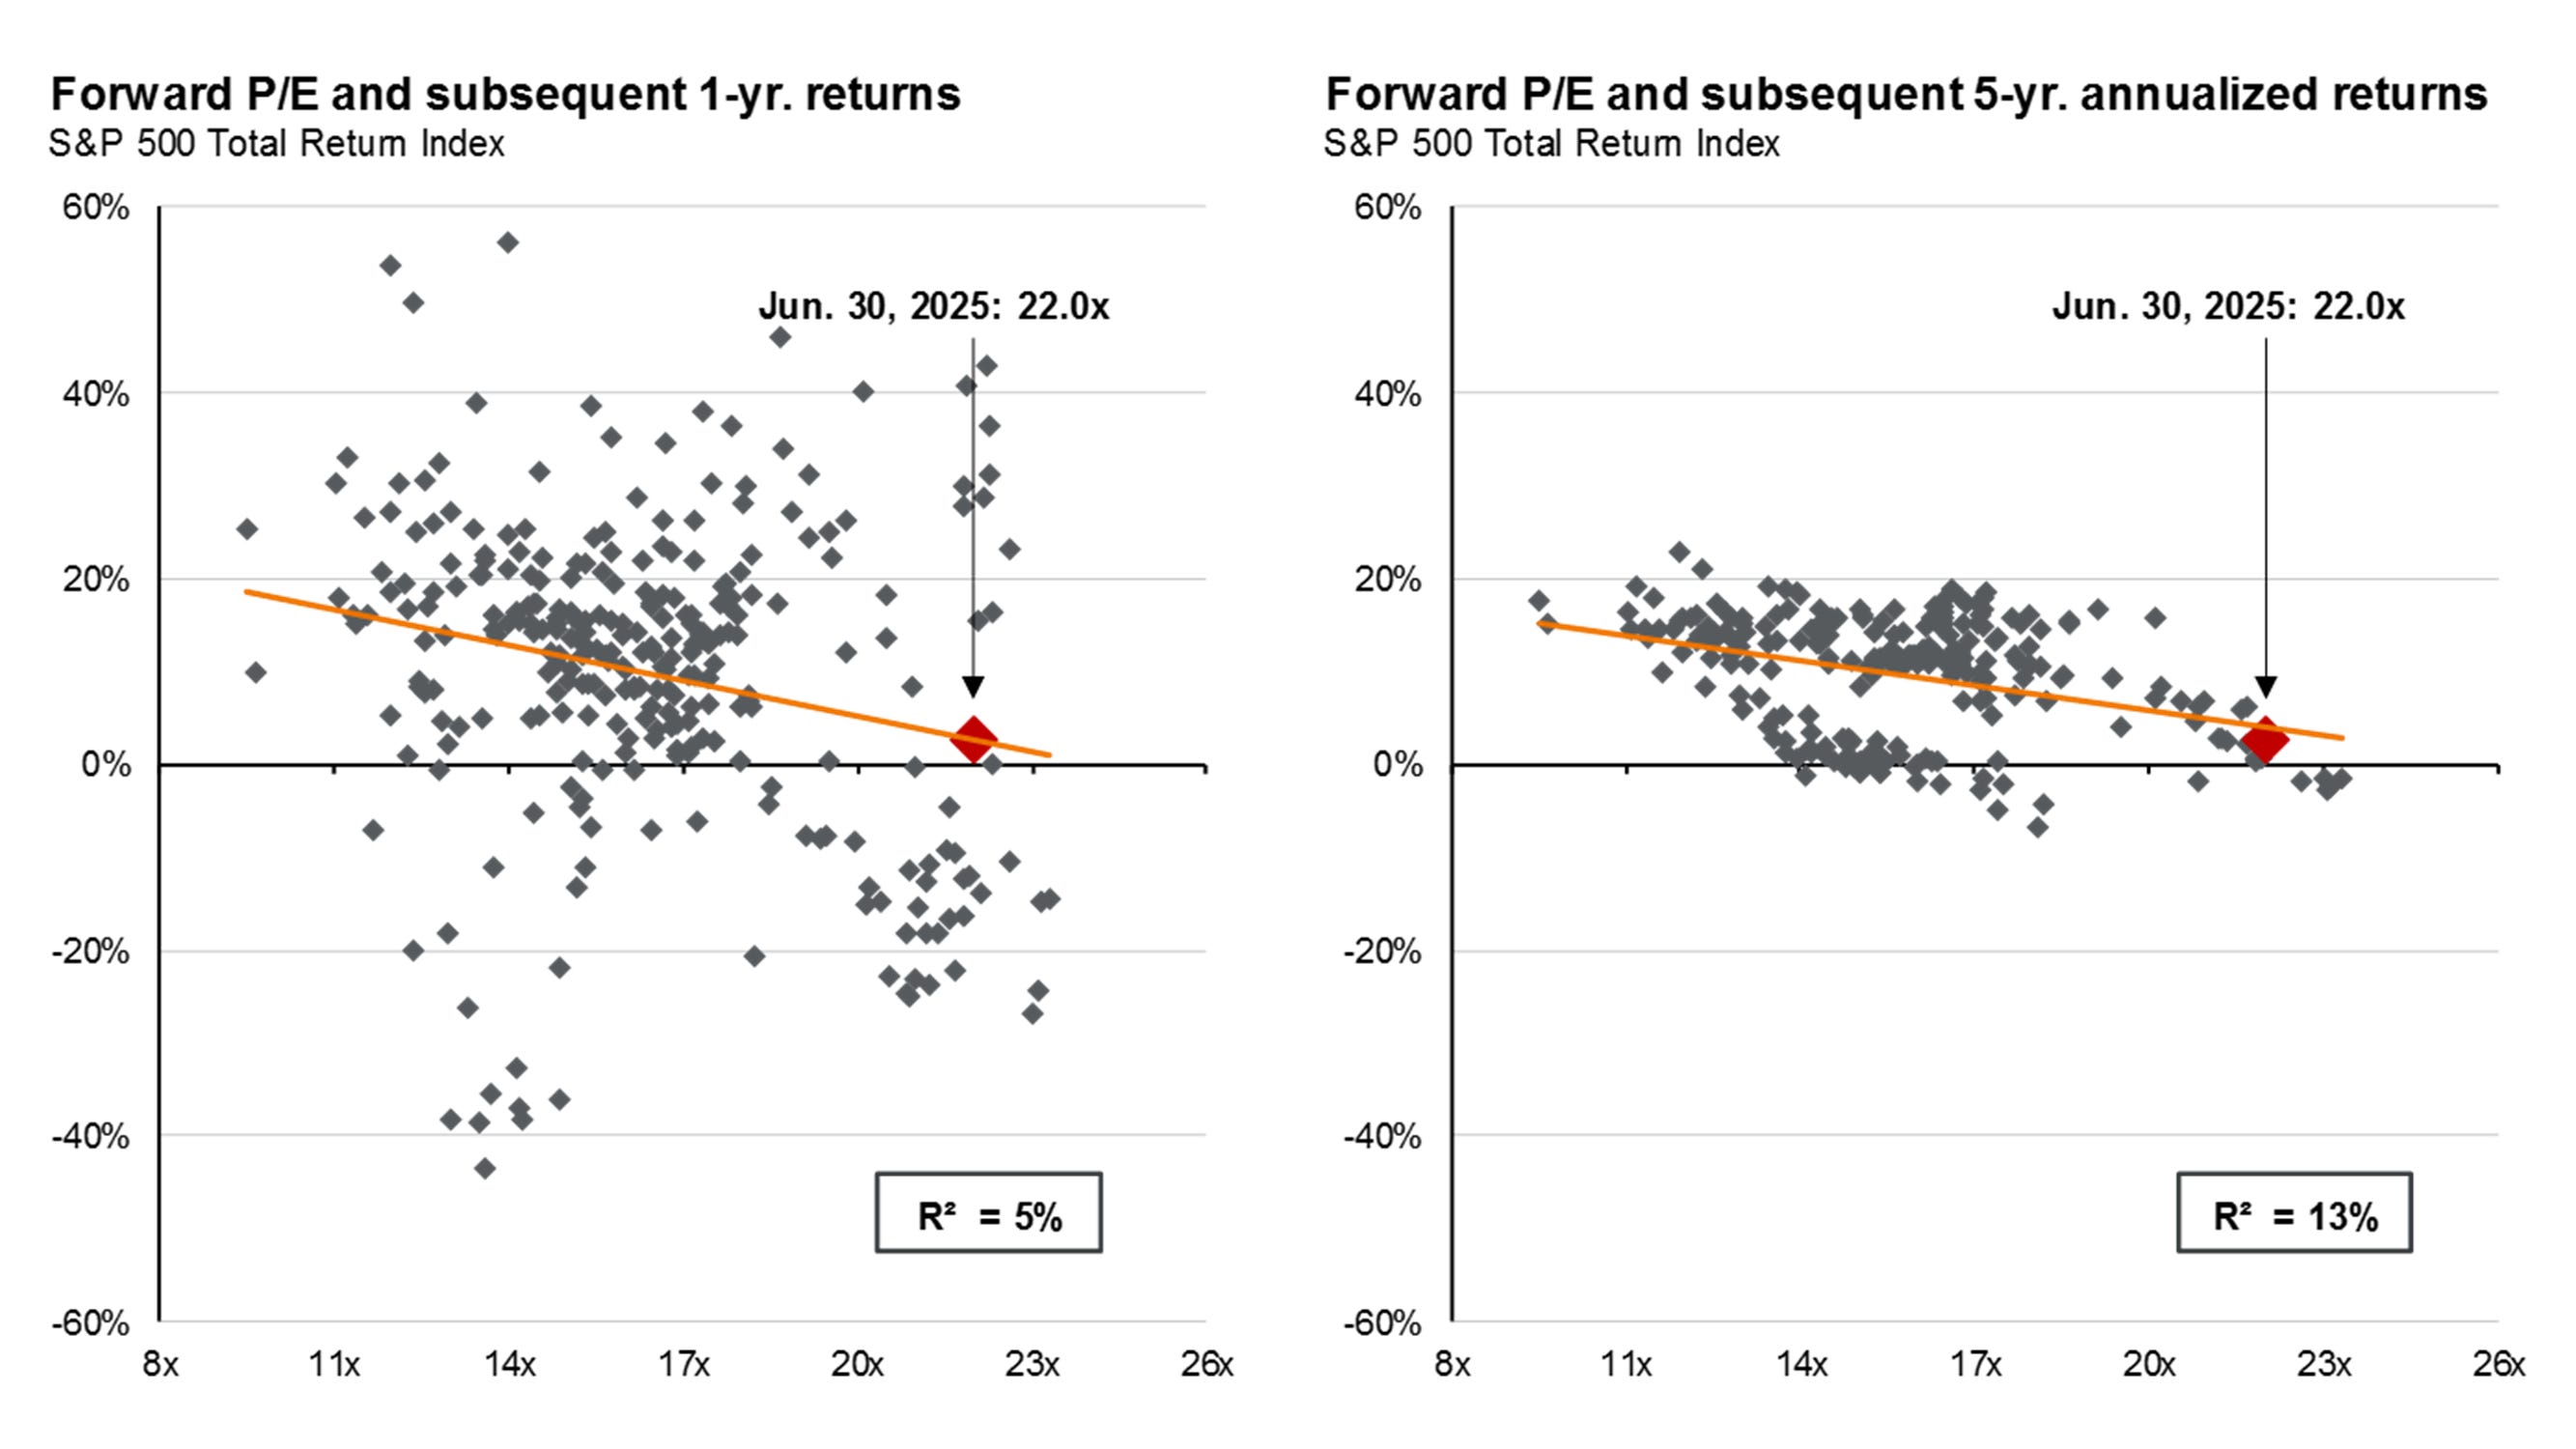
Starting from a high valuation, as we said before, 22 times forward earnings, returns for the subsequent 1-year and 5-year periods are slightly positive, but close to zero. This means that investors should lower their expectations of future returns, especially if they invest in an index fund of the SP500.
S&P 500 year-over-year EPS growth
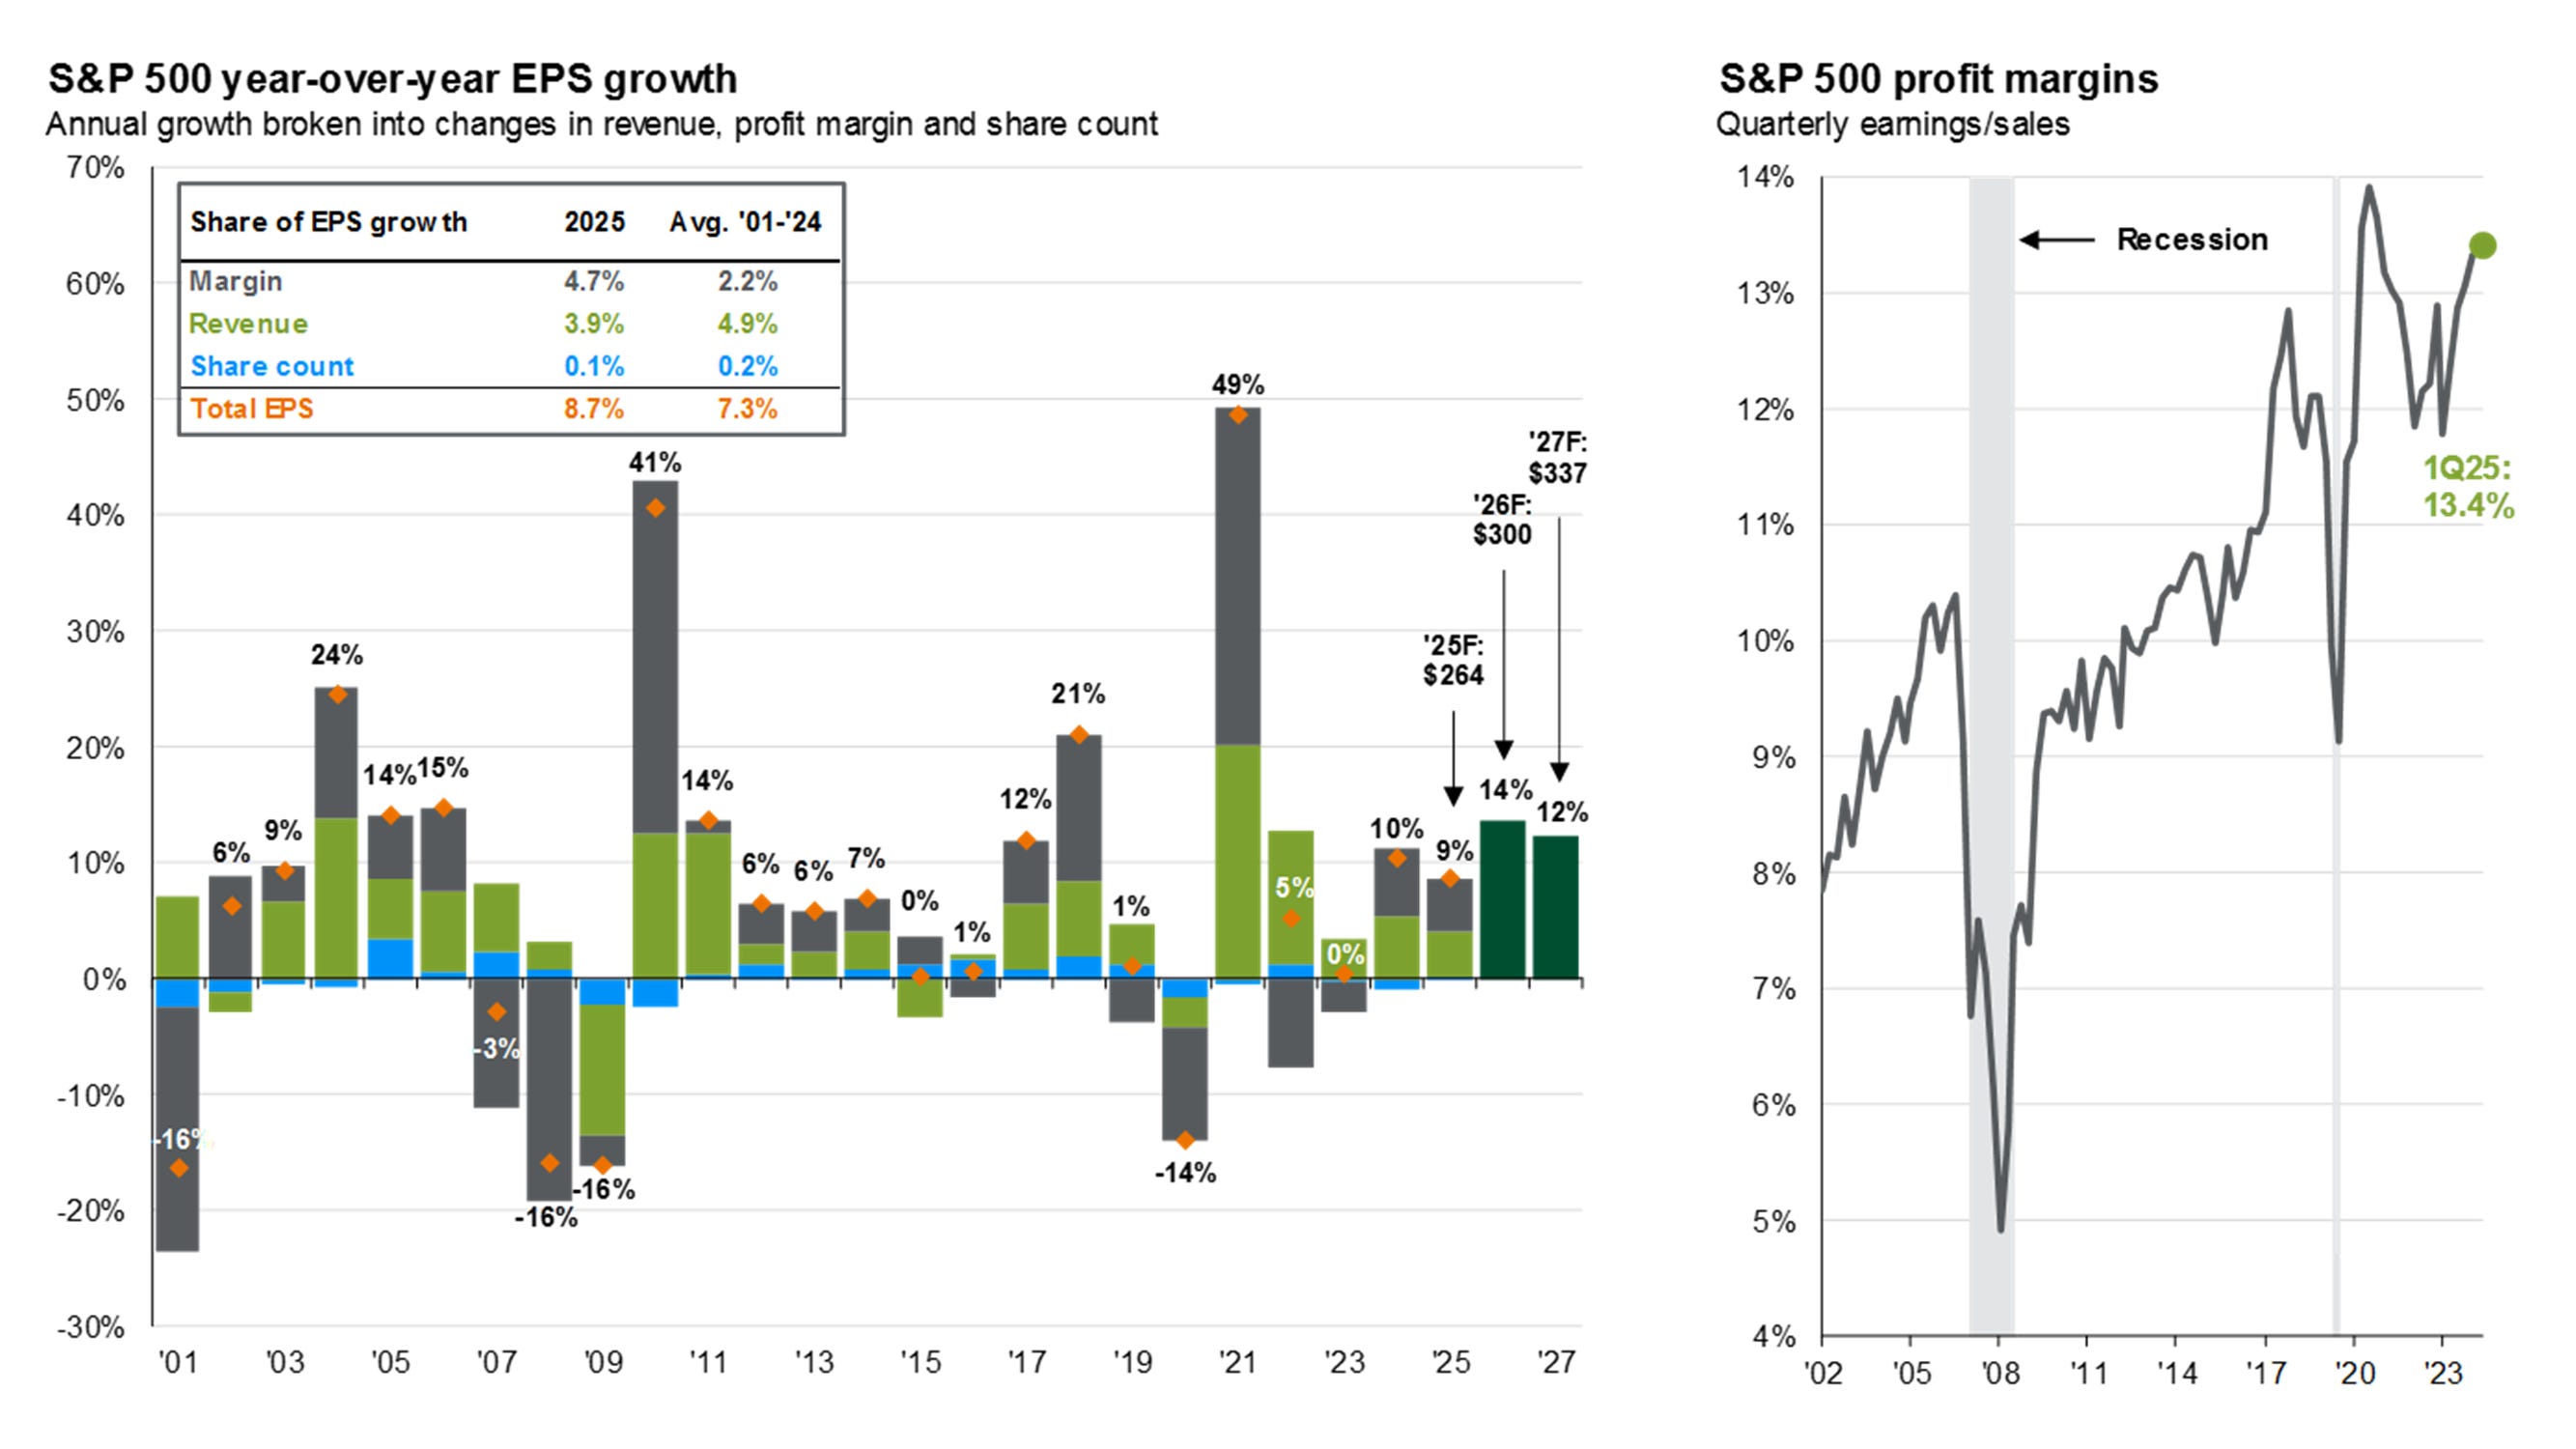
Much has been said about “American exceptionalism” in the stock market. Needless to say, the past decades have been great for the US stock market. But it’s interesting to see how important margin expansion and revenue growth have been for the SP500 returns. From 2001 to 2024, revenue growth has added 4.9%, or 67% of the total return. Margin expansion has added 2.2%, or 30% of the total return.
Moving forward, EPS growth is quite optimistic for the coming years. But since we are at a point in time where profit margins are at the highest point of the past 25 years, I wonder if those estimates are too optimistic. Either revenue growth surprises on the upside significantly, or future EPS growth will fall short of expectations, since profit margins cannot keep expanding forever.
PE of the top 10
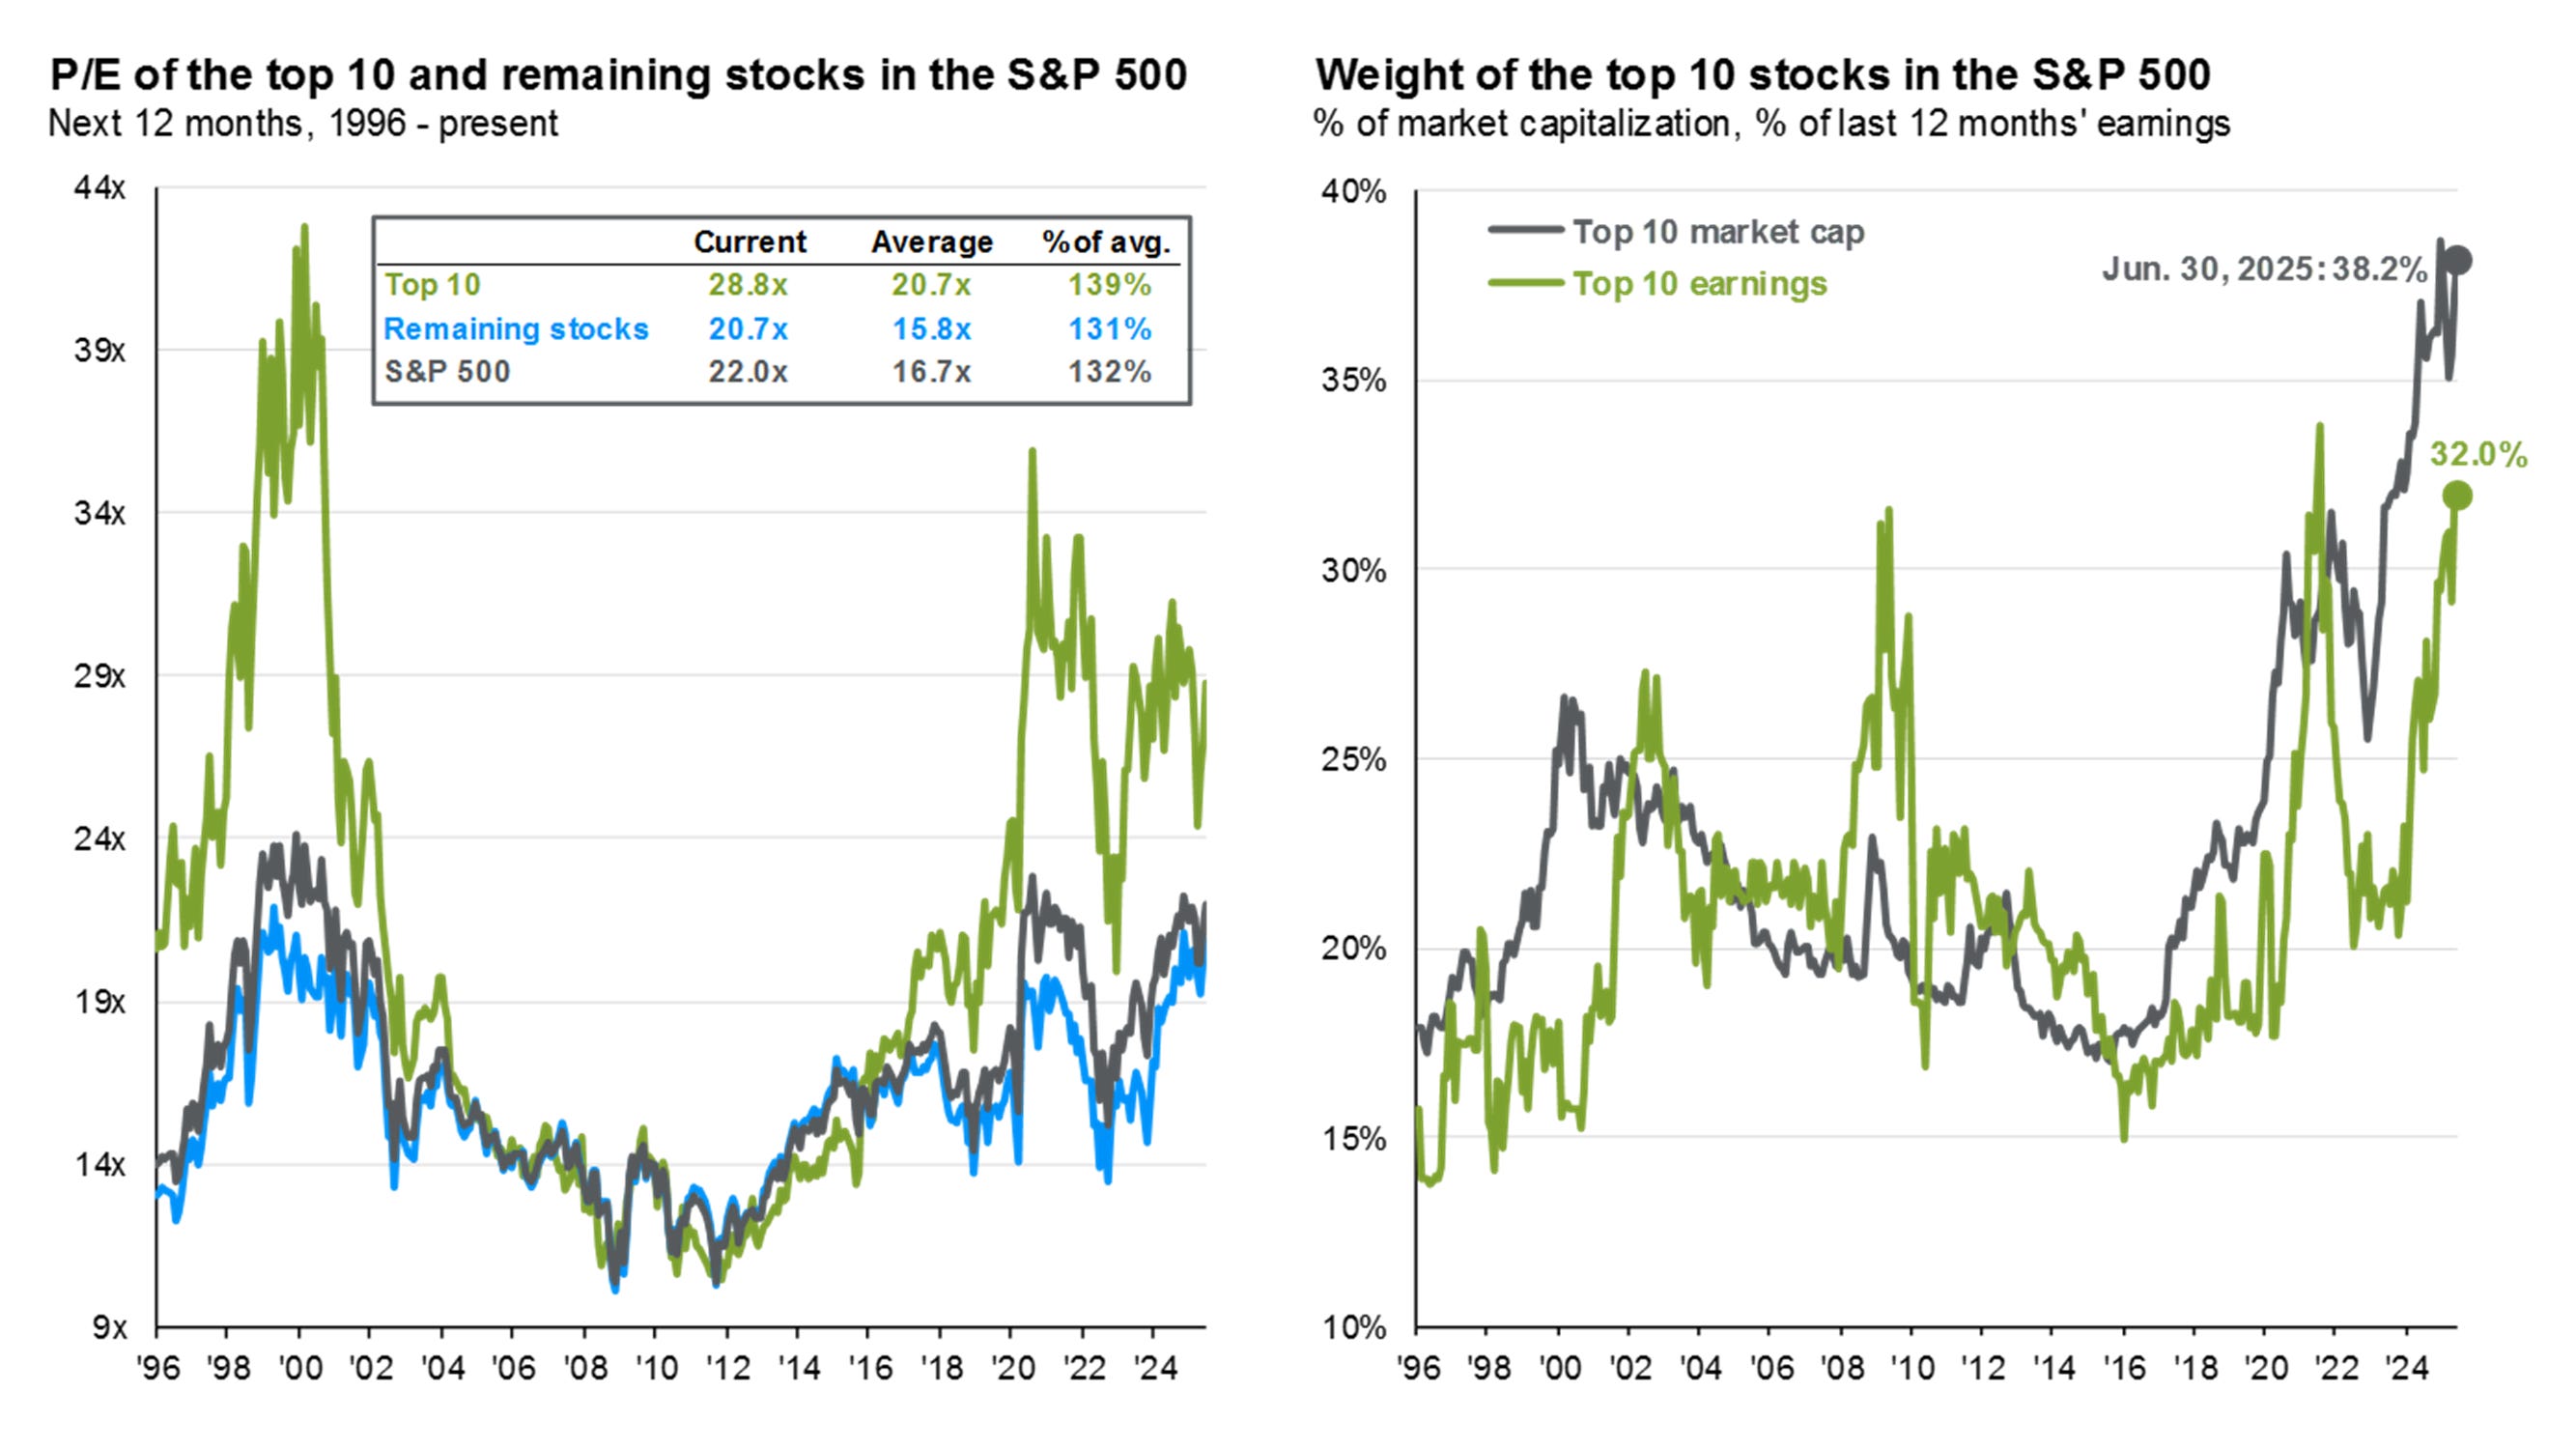
The earnings percentage of the top 10 companies over the 500 companies in the index sits at an all-time high: 32%. The index concentration, hence, is quite high, since the weight of the top 10 companies by market capitalization is currently 38% of the total index.
Diversification is more an illusion than a reality in the current SP500.
Another observation I would like to make is that it is often said that the current valuation of the top 10 holdings reflects their quality. For that reason, people tend to justify the current PE ratio of the top 10, which is 28.8 times earnings, which is a premium of 39% over its historic average (since 1996). However, I don’t consider that the quality of the rest of the business within the index is much higher than it has historically been, and despite that, the remaining stocks of the index also trade at a 31% premium over their historic average (20.7 times compared to 15.8 times).
Performance of Magnificent 7
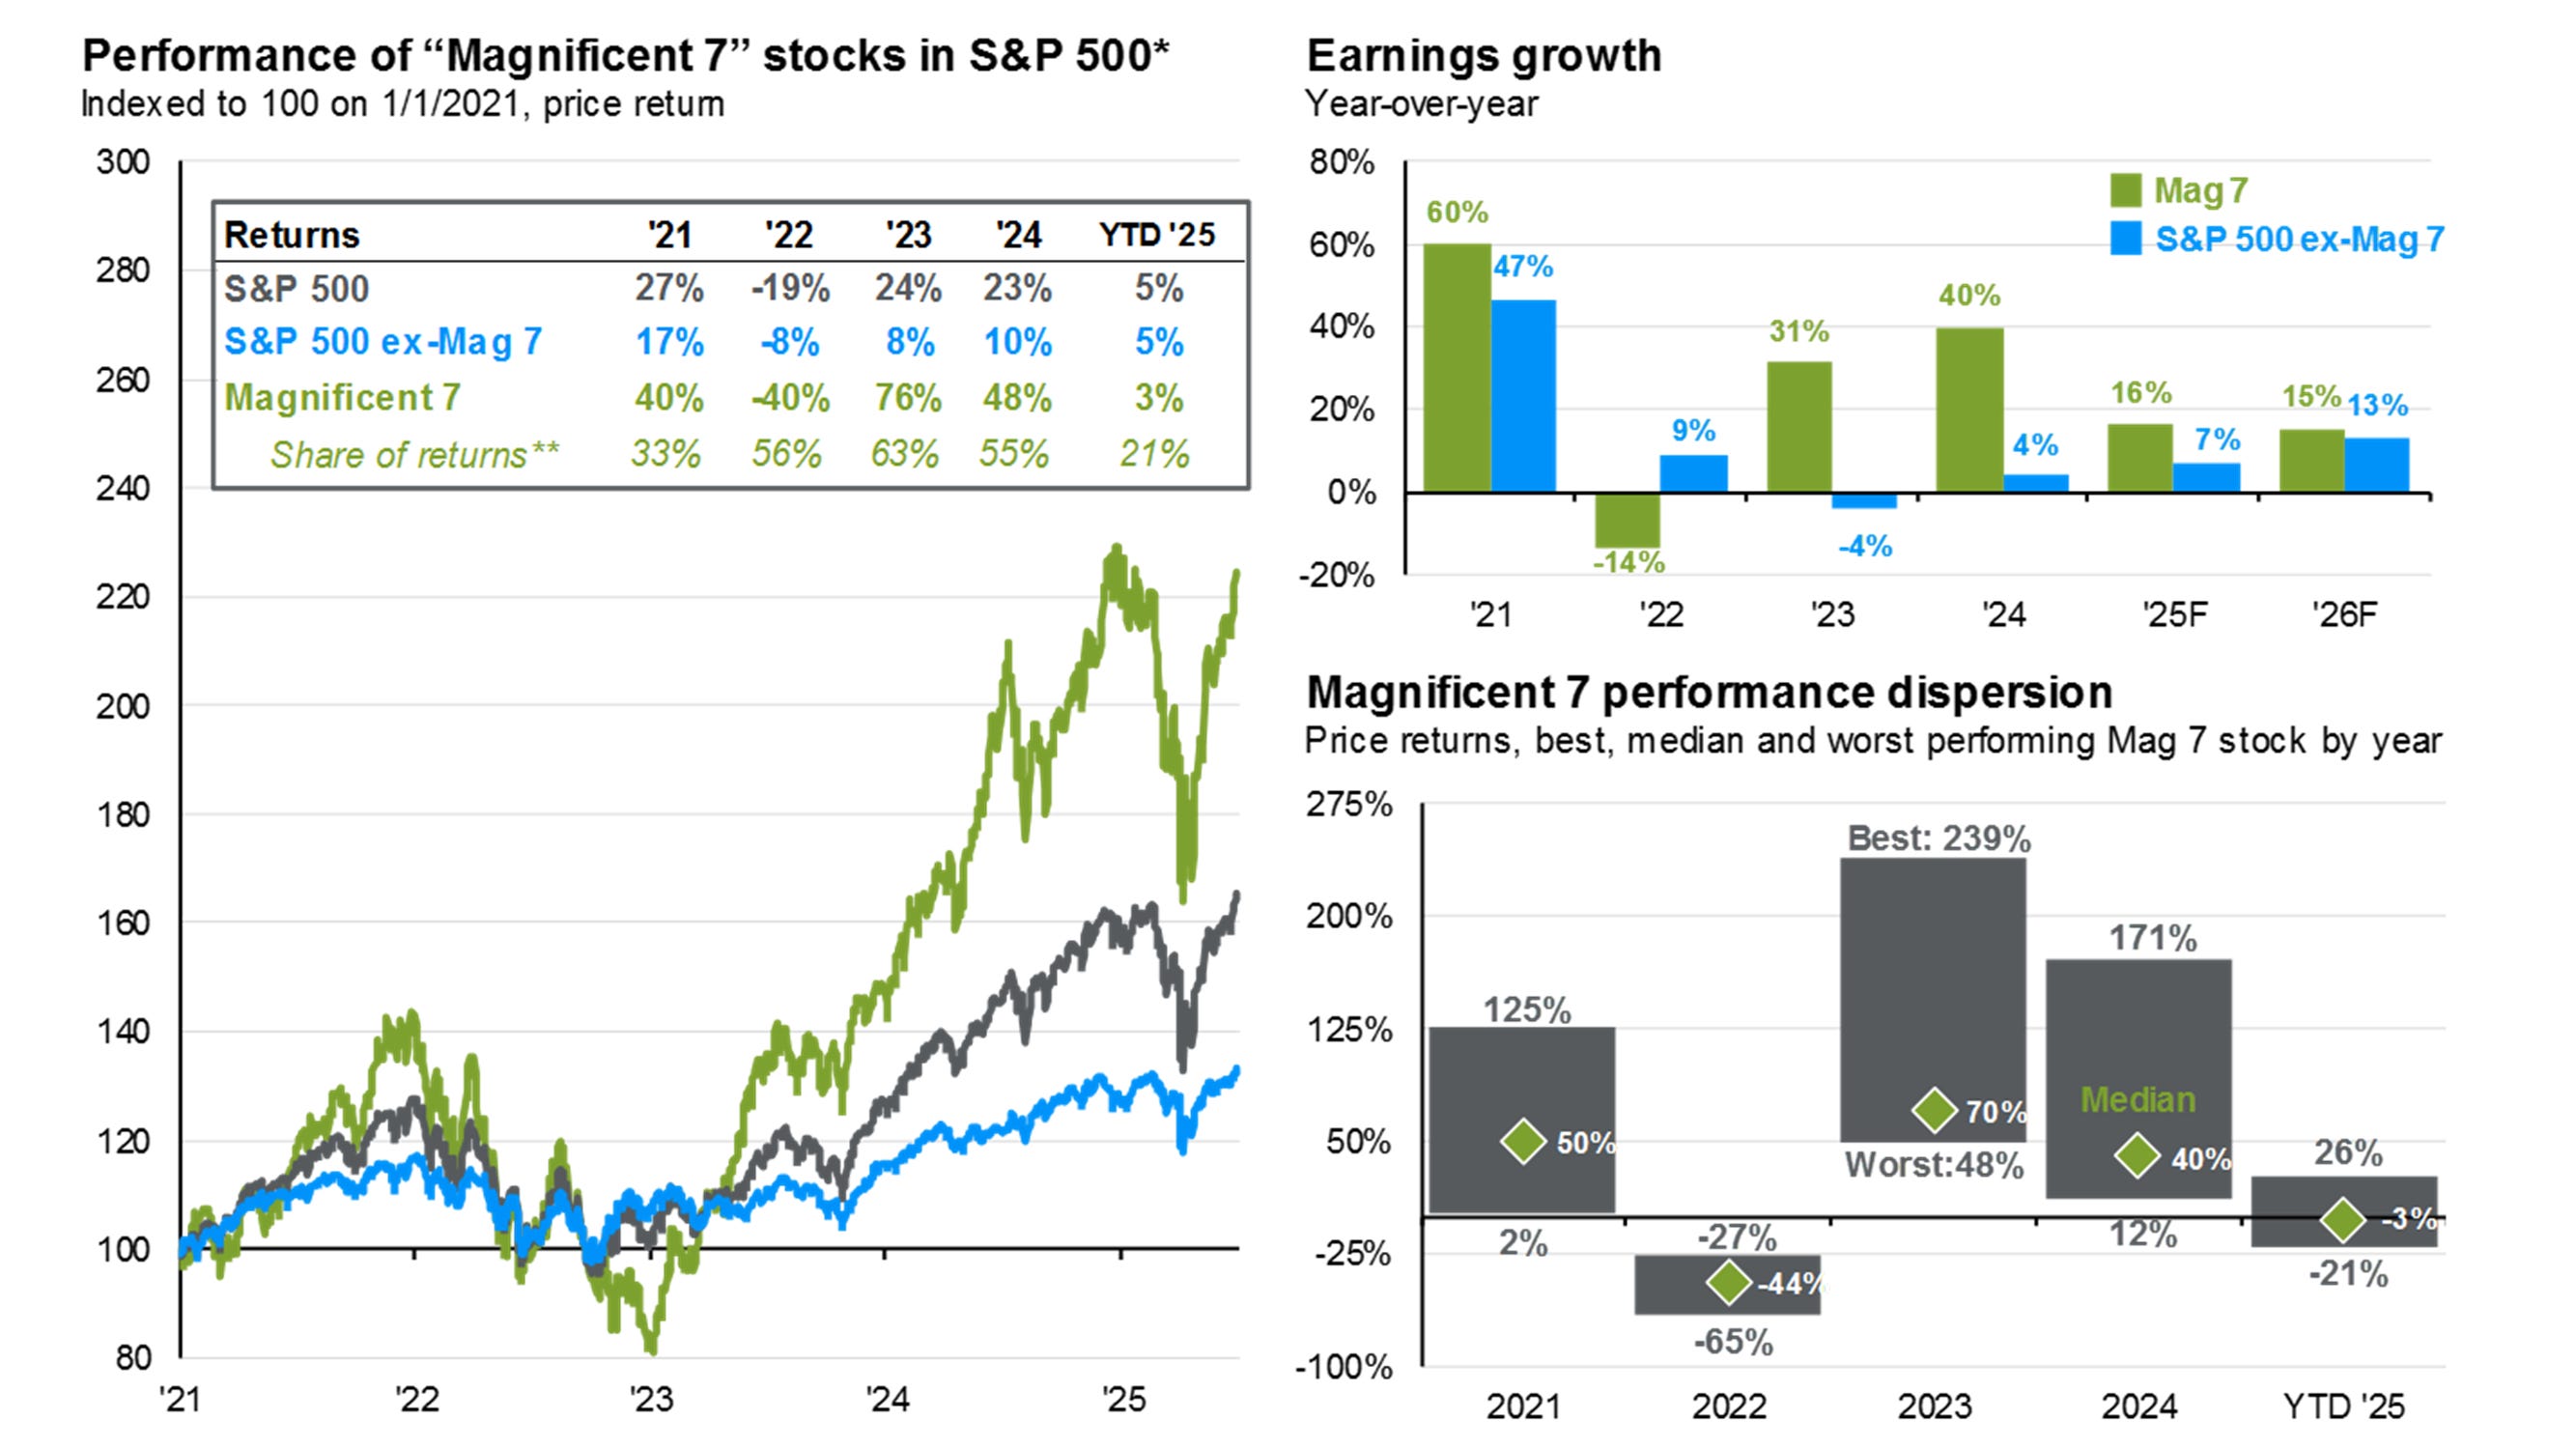
It’s no surprise that the Magnificent 7’s share of returns is quite high. From 2021 to 2024, the lowest share of returns of the Mag7 has been 33%, and the highest, 63%.
This has been caused by the higher earnings growth of these 7 stocks. However, people tend to forget that these businesses are also cyclical, as they proved in 2022. What works during the way up also works on the way down.
S&P 500 intra-year declines
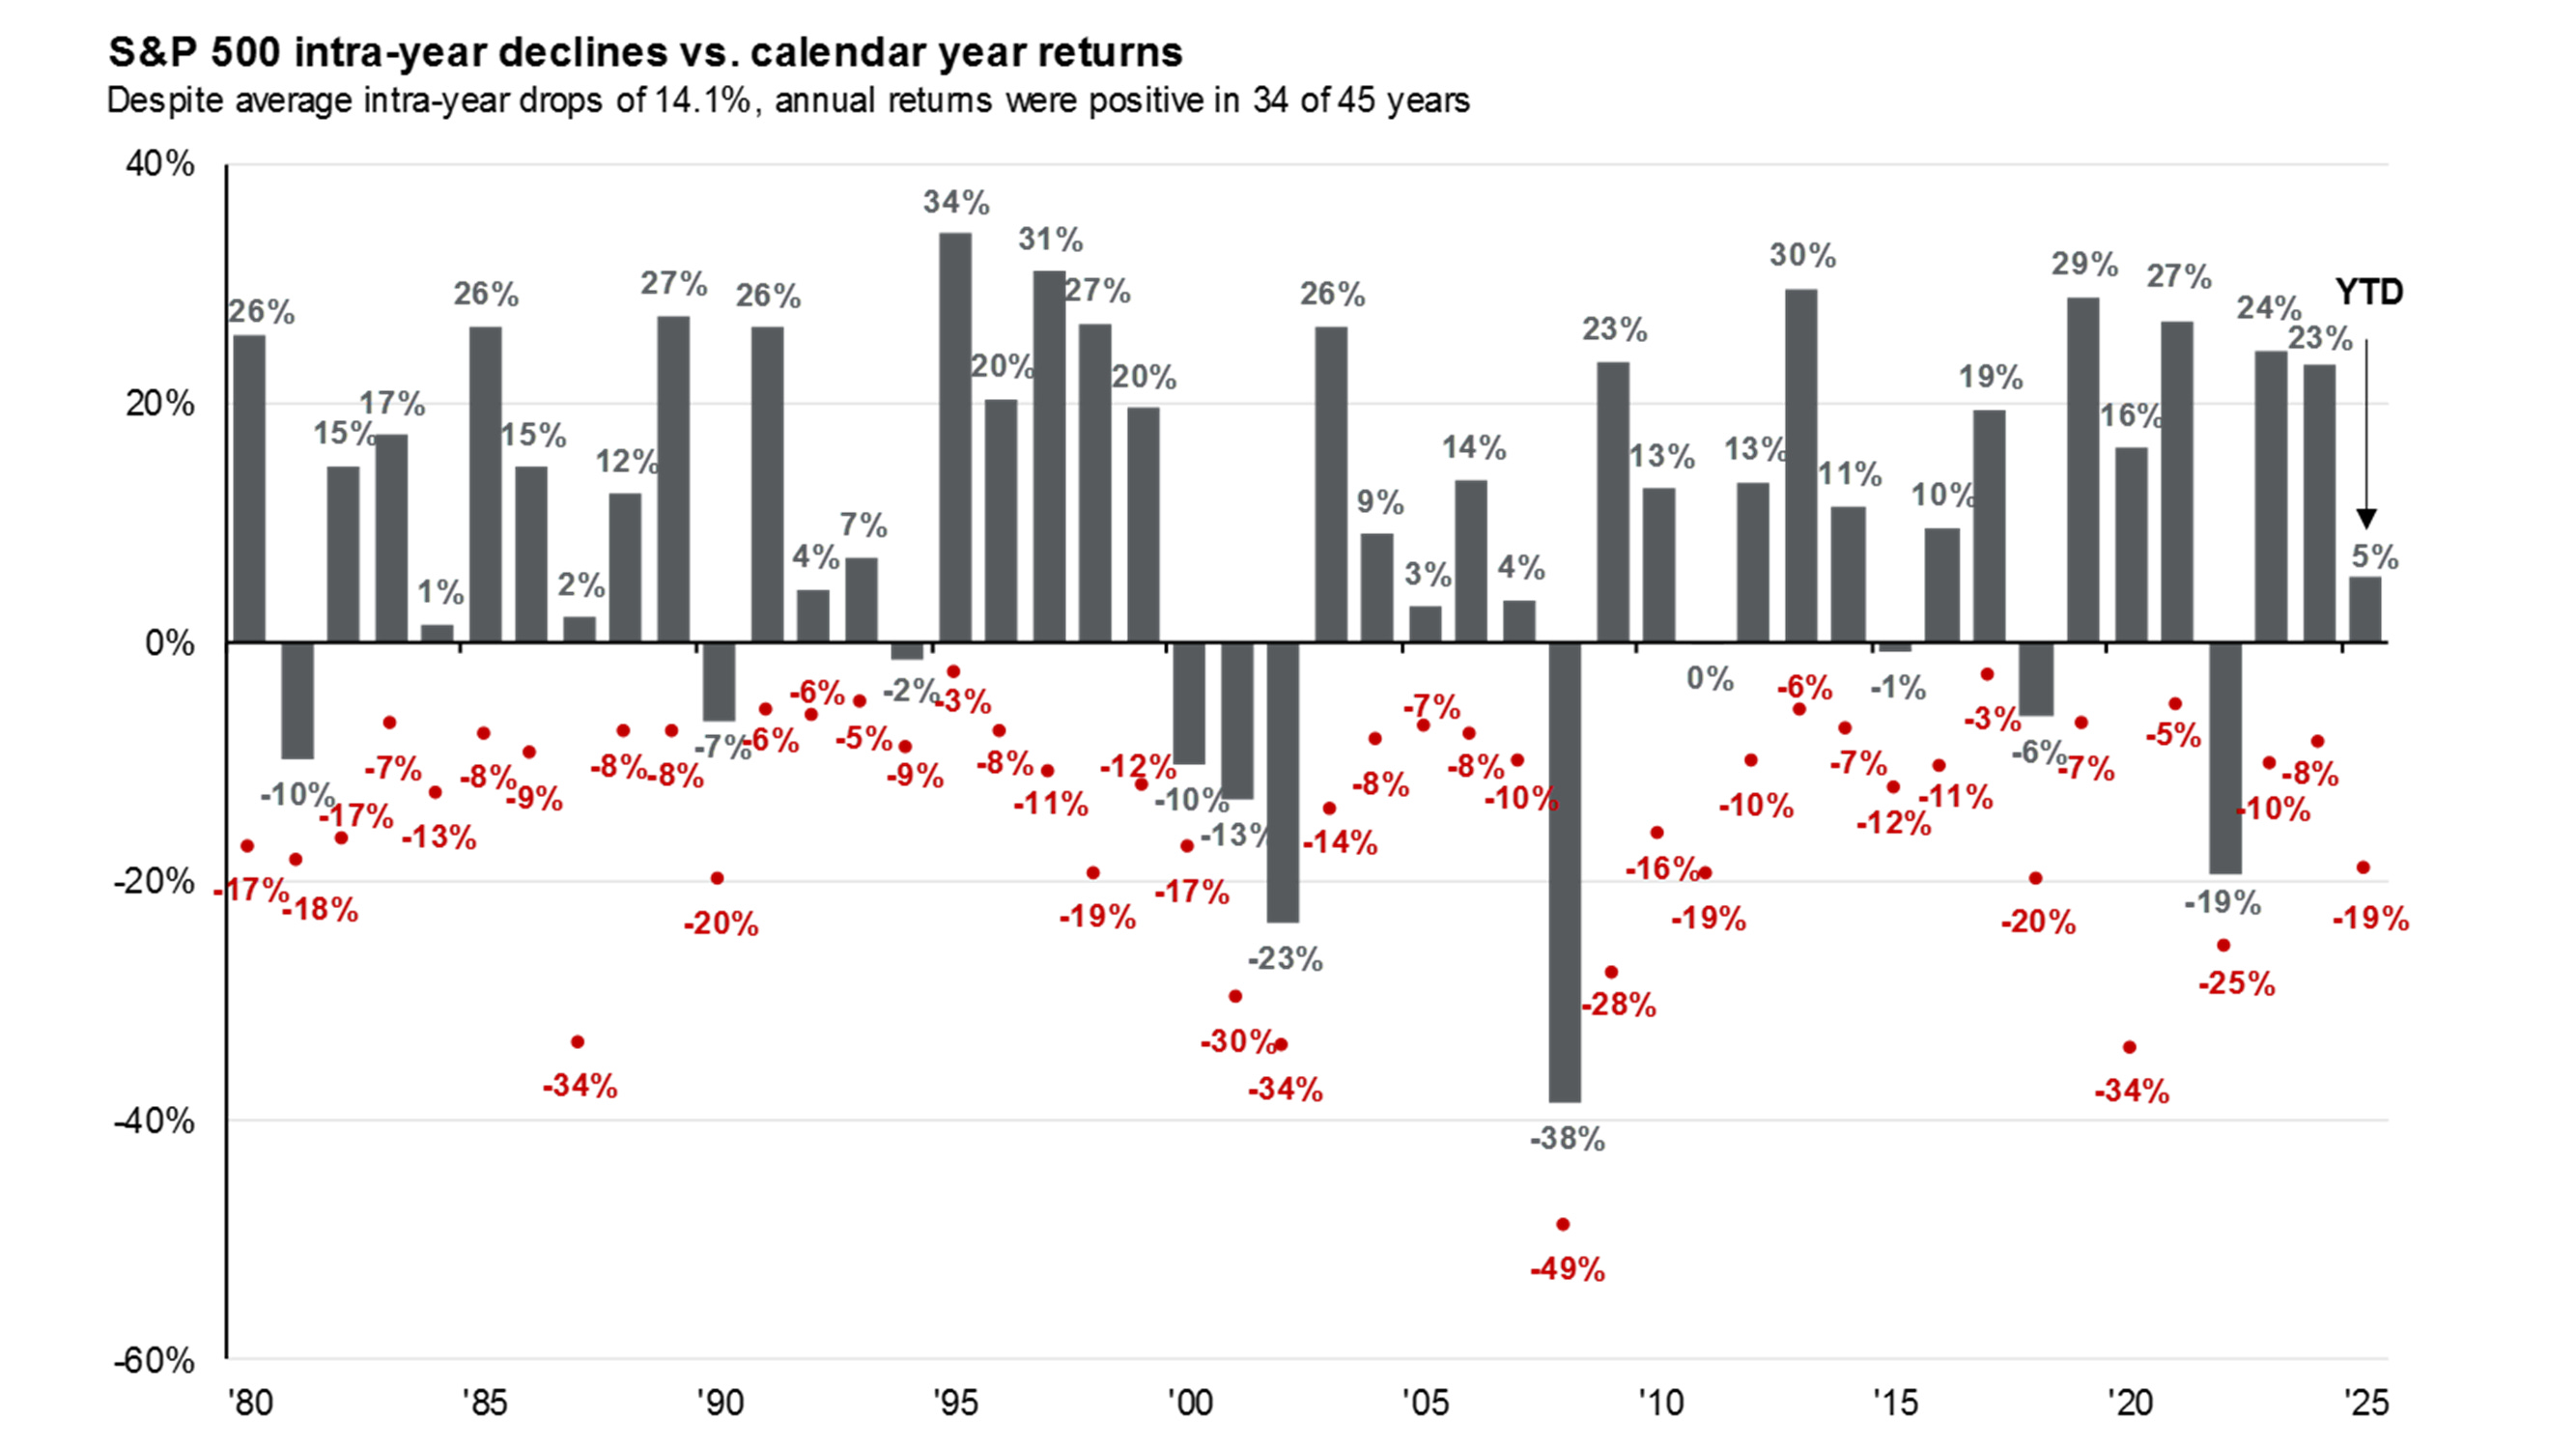
There’s no year without decline. Even in years when the index has performed pretty well, intra-year drops are common and usually deep. But as we saw before, investing in stocks may be volatile with a short time frame, but it is rewarding in every scenario if the time horizon is long enough.
Sources of global equity returns
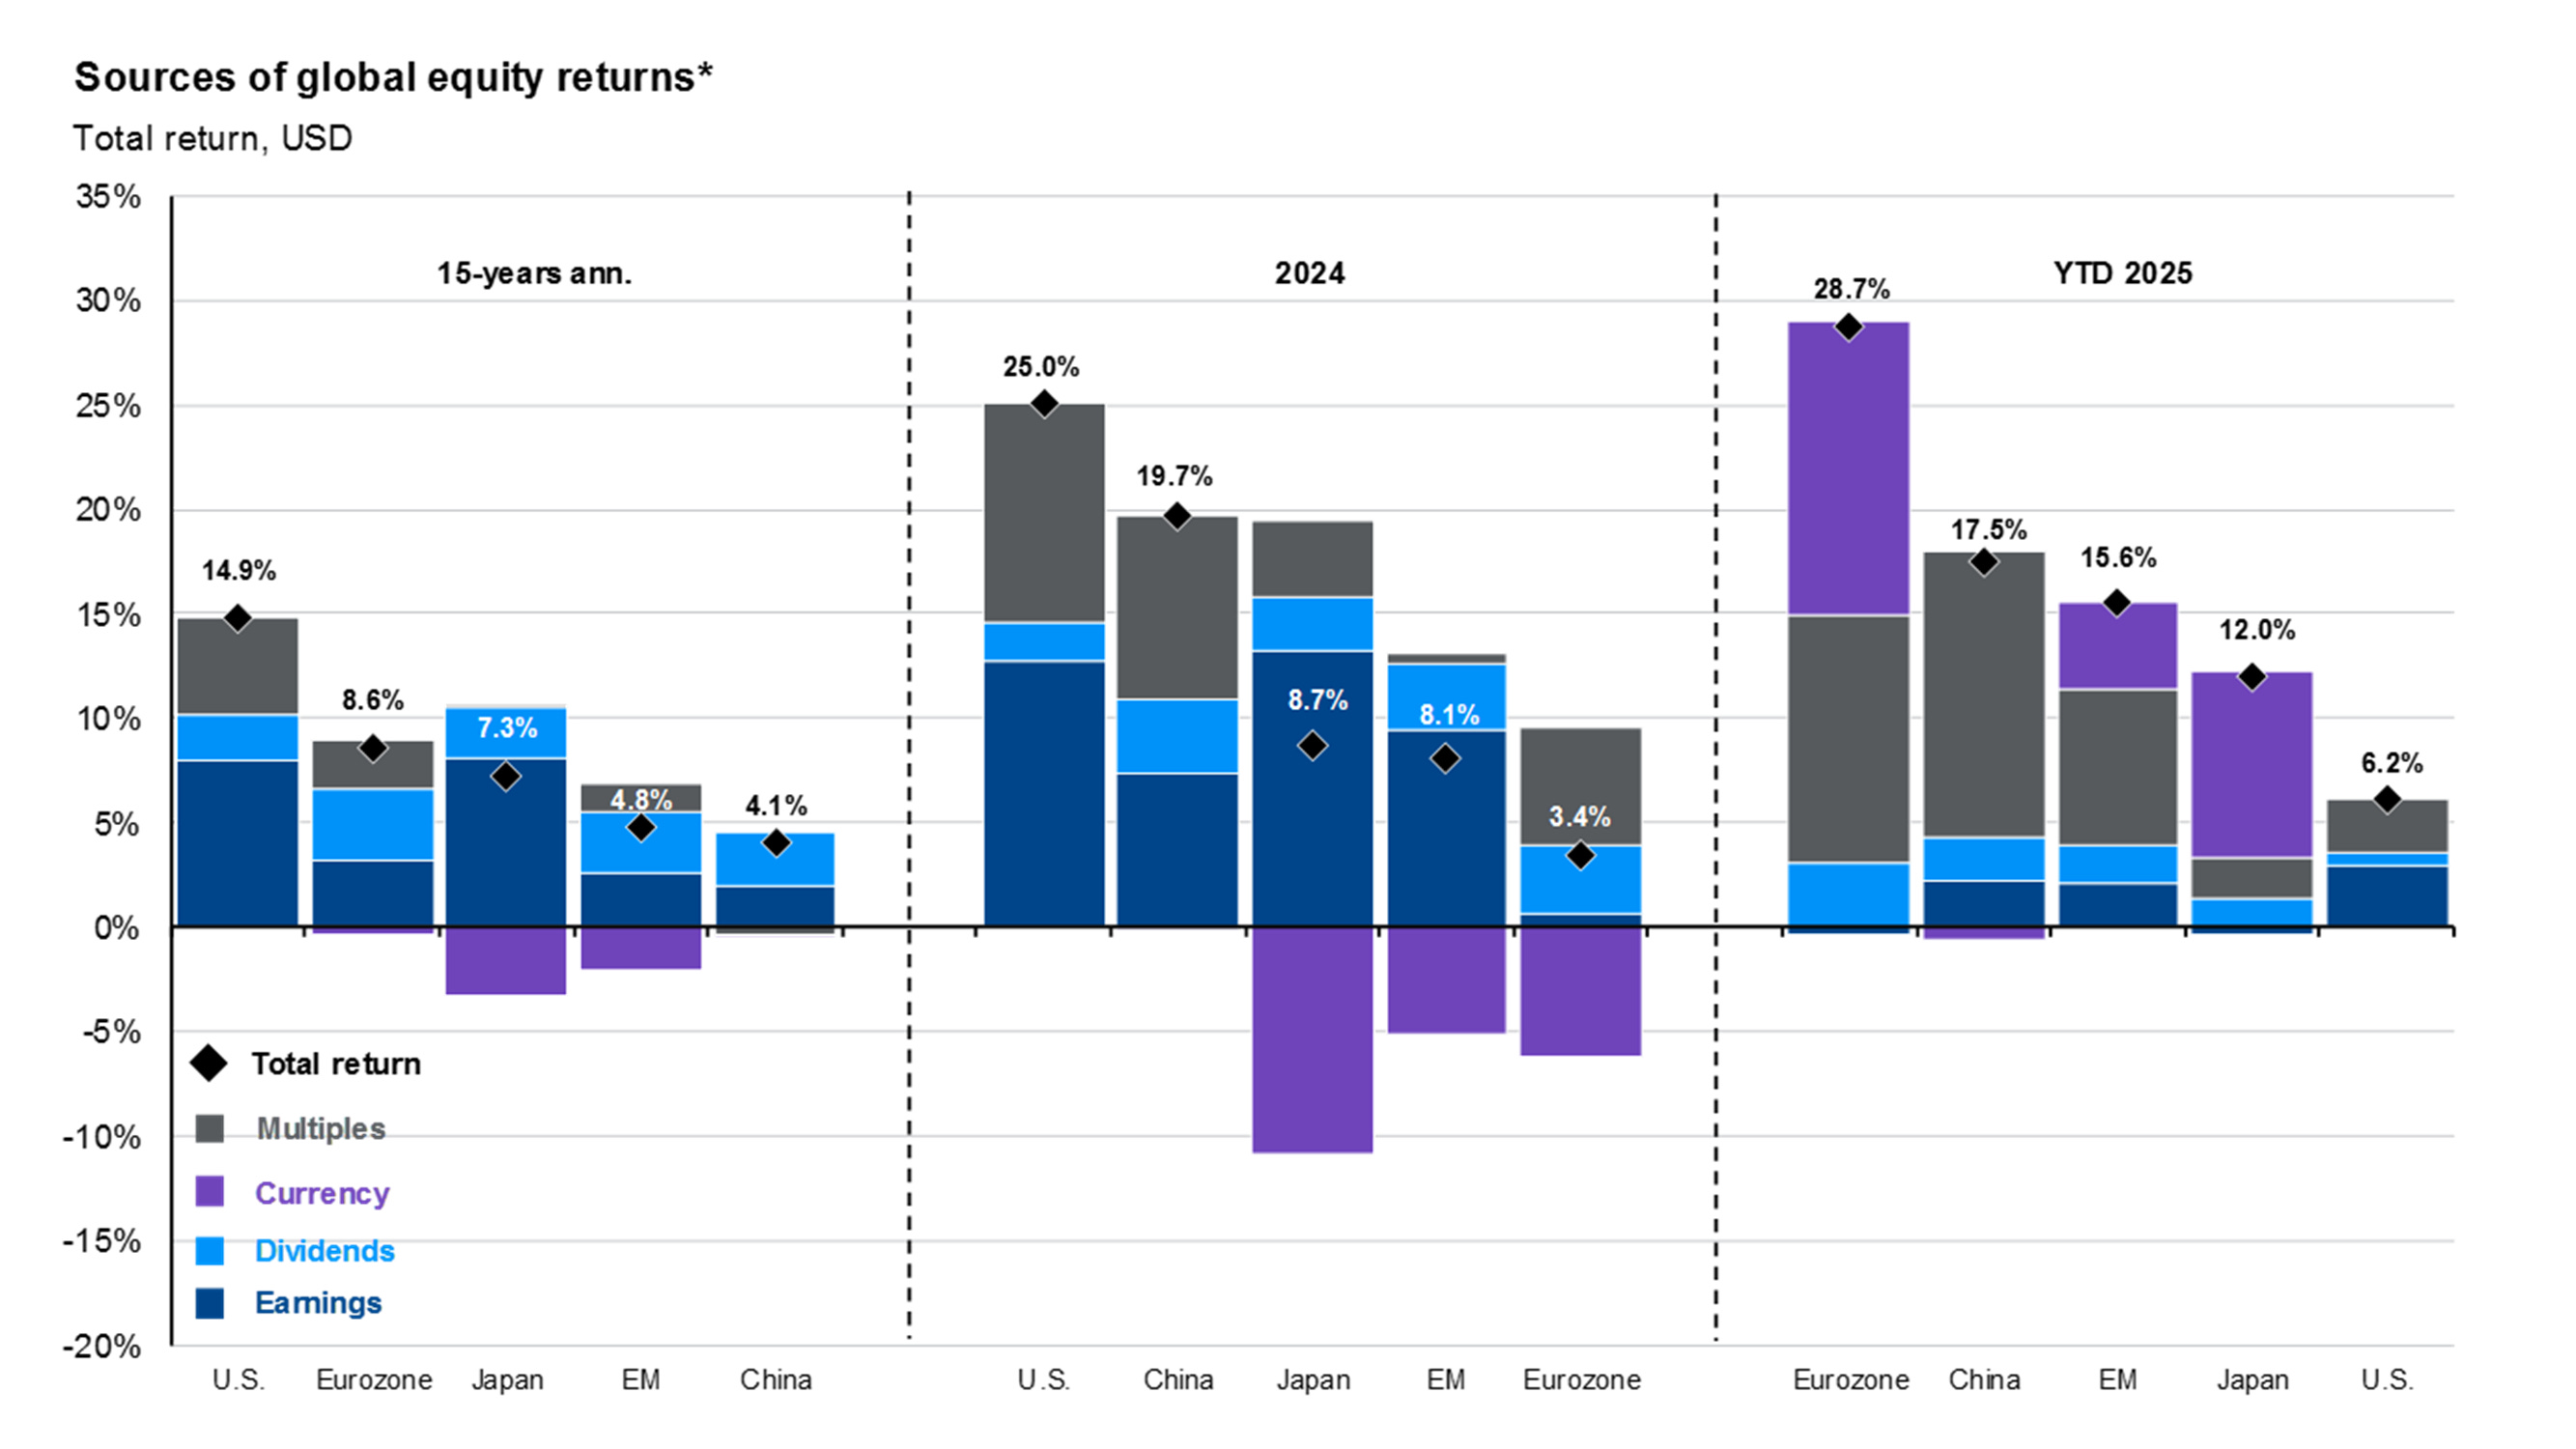
Coming back to the exceptionalism of the US stock market, I’m skeptical that it will be maintained in the coming 15 years. Don’t get me wrong, earnings and dividends will probably grow. My skepticism comes from the multiple expansions’ share of returns. In the US, during the past 15 years, a total return of 14.9% per year, about 5% has come from multiple expansion. That means that the current starting point is probably too high to be maintained, so in a best-case scenario, we could think of multiple expansions adding 0% to the future returns. I could see a future where multiples actually deduct returns for the coming 15 years.
It’s also interesting to see how, in shorter periods of time, multiples move the market. However, in longer periods of time, earnings and dividends are the most important factors.
Valuation by country
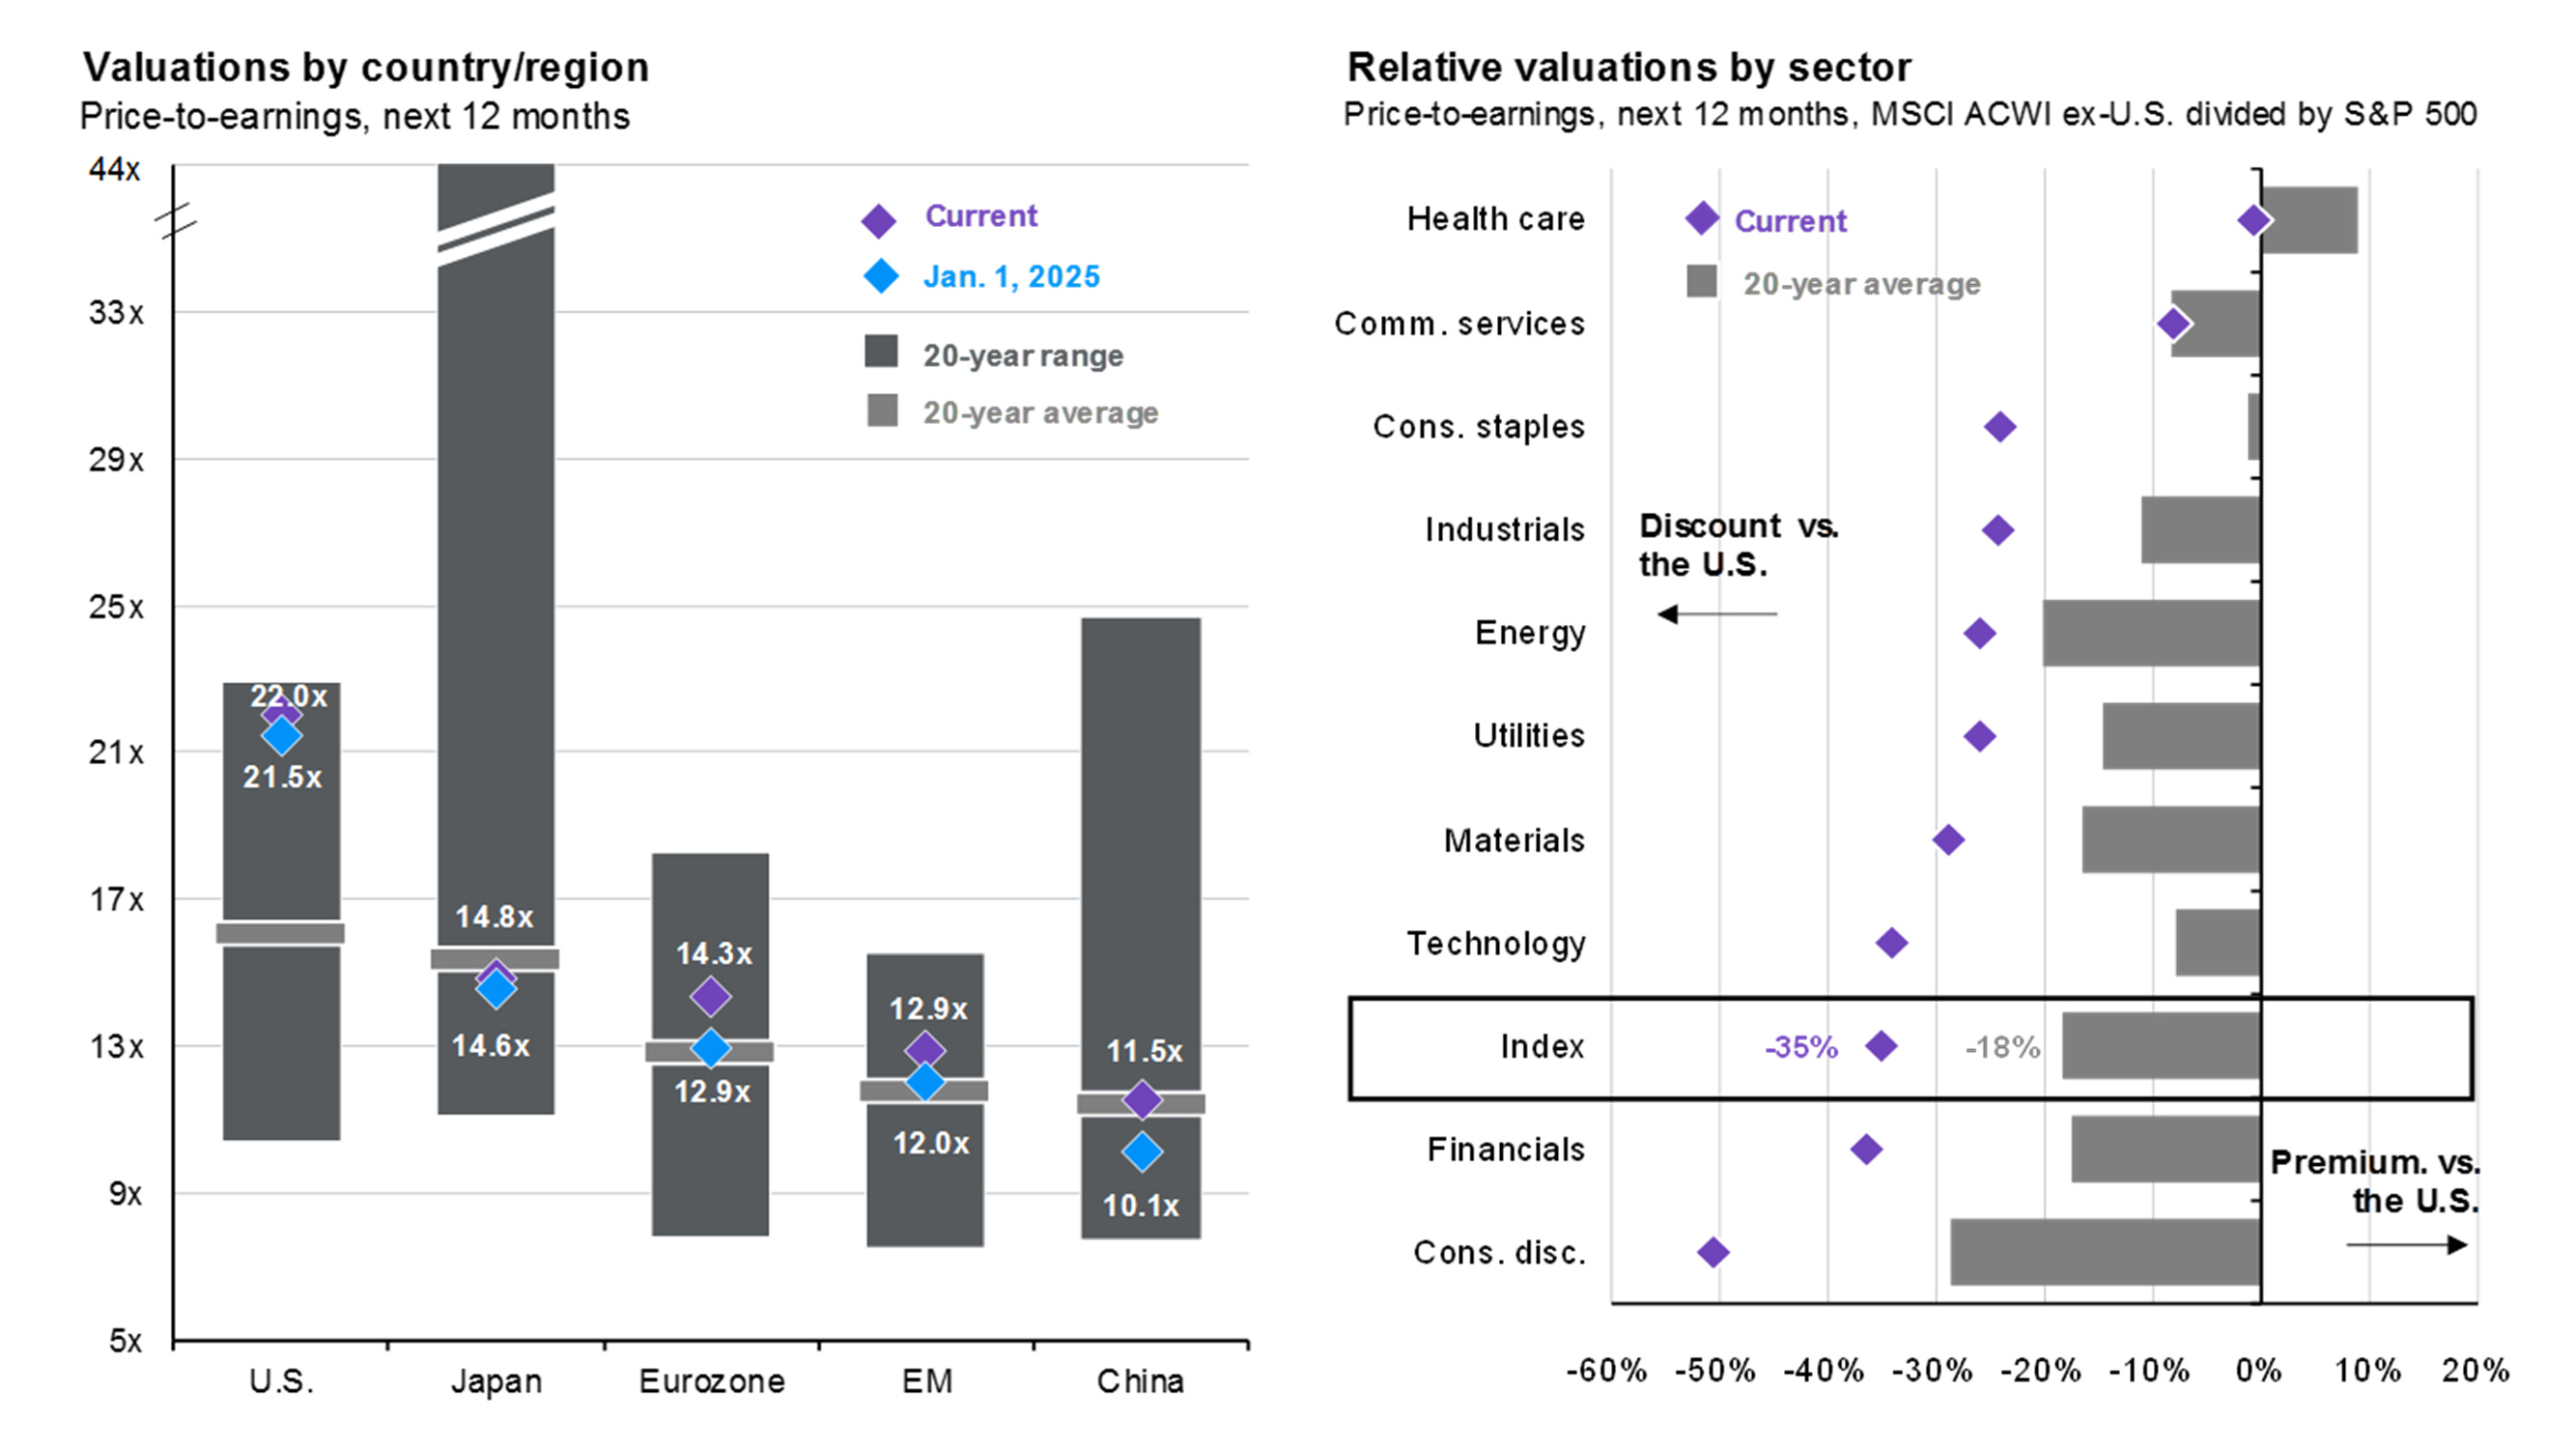
The US currently trades at the most expensive multiple valuation of the past 20 years. Also, every sector but healthcare trades at a premium compared to the rest of the world.